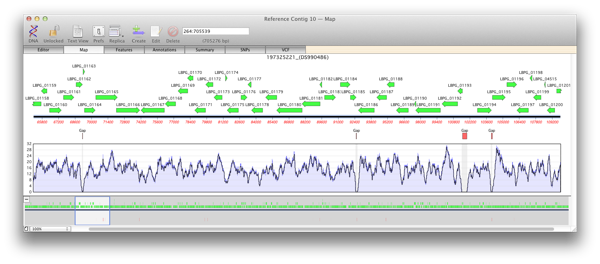
There are two main steps to creating a reference assembly. Mapping your reads against your reference sequence and then analysing the alignment for variations. Knowing the depth of reads, or coverage, of an alignment is important for both of these stages. A low average depth of coverage means that you have less confidence in the called consensus and a high average depth of coverage depth means you have spent too much money on sequencing. Even more important are regions with reads well above or below the median level of coverage which can indicate anomalies or variations in the sequence.
When you generate a reference contig with Bowtie, the Map view of a reference or child contig will show a plot of the depth of reads along the entire reference. This coverage map shows four statistics. A single plot line (default color is black) shows a running average of the number of reads at that point, calculated using a moving window of varying length depending on the zoom level. Such a plot is not sensitive when the window shows a large region of sequence at a high level, for example when viewing megabases of sequence). So two shaded areas indicate the highest value (default color is dark blue) and the lowest value (default color is light blue) of the reads averaged for that window. As the coverage map is viewed at higher magnifications then the window from which the running average is calculated becomes shorter and so these three values will become closer to the extent that when viewed at, or close to, sequence level these three plots will become identical.
Regions of zero coverage
Areas of zero coverage are shown in light grey. Note that these areas are always displayed even when they are disproportionate to the level of magnification. For example a region of zero coverage will always be displayed even when you are viewing a 20 megabase contig in its entirety. Also note that there are no areas of zero coverage in child contigs as by definition they are bounded by either end of the reference contig and/or an area of zero coverage. If you hover the mouse over the coverage map it will give the exact number of reads at that position (for example X reads over base XX).
Regions with low coverage
There are many reasons why regions will have lower than average coverage. These generally are caused by the base composition over that region. For example regulatory elements in a sequence, where proteins such as transcription factor bind, do have lower than average coverage perhaps due to their GC content being low.
Regions with high coverage
Short regions with excessively high coverage can be indicative of a repeated region that may or may not be present in the reference sequence. Reads will be piled up on one of the repeated sections rather than being spread out over each repeated region. Paired end reads can go some way to help detect these and allow correct alignment of reads. Also do remember that you may have the same read mapped to multiple locations on the reference unless you select the “USE BEST ALIGNMENT ONLY option

Further Analysis
The coverage map makes it very easy to design primers for further sequence, for example Sanger sequencing for hybrid assembly. Remember that you can run general MacVector analysis tools directly on a contig and it will act as if you are running that analysis on a single sequence.
Here’s how easy it is to design primers: