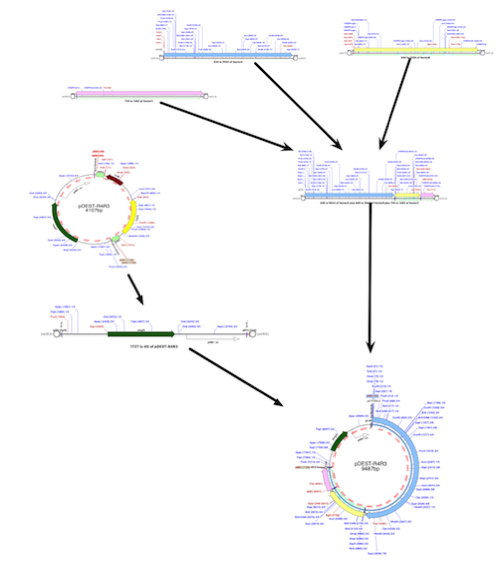
We’ve previously discussed how every ligation is documented. You get a Frag annotation that contains the date, source sequence, enzymes used and any end modification that was done to that fragment during the ligation.
However, we had regular requests to make it easier for users to document their constructs in other ways. For example, being able to construct a flow chart showing how a construct was made for your lab book.
So in MacVector 14.5 we added PDF export to the Cloning Clipboard. Now you can copy and paste a digested fragment directly into a graphical application, such as Adobe Illustrator. This makes it easy to create a flowchart of a cloning strategy.

The fragment is copied, exactly as it is displayed in the Cloning Clipboard showing restriction enzymes that have been used to digest it. All fragments are copied as linear images, so if you need to show a circular vector, then in the Map tab just copy and paste that. The fragments are copied at a fixed width size, irrespective of the actual fragment sequence length. However, if you need finer control over your fragment before creating a PDF of it, then simply double click on the fragment. It will appear in a new MacVector sequence window which you can modify before copying it as a PDF.