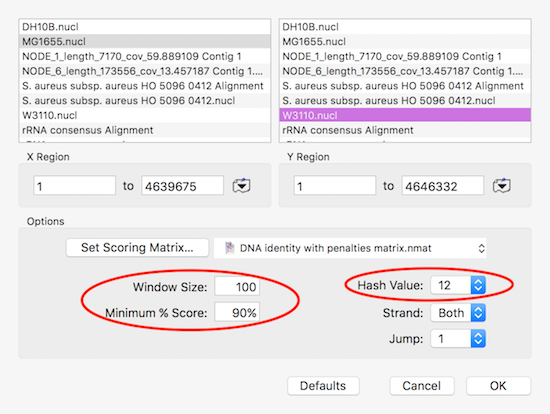
MacVector’s Analyze | Create Dot Plot function can be used to compare entire genomes very quickly to get both an overall view of similarity (large inversions and duplications) while providing the ability to “drill down” to the residue level to see individual SNPs. One of the keys to ensuring the calculations complete in a reasonable length of time is to set the Hash Value to a large number, typically 11 or 12. For example, to compare two E. coli genomes (~4.6 Mbp) these settings are a good start.

On a typical laptop, with these settings the calculation takes just a few seconds to run. But the resulting plot clearly shows the well documented inversion in E. coli strain W3110 relative to MG1655 due to a recombination between the rrnB and rrnE rRNA gene clusters.

