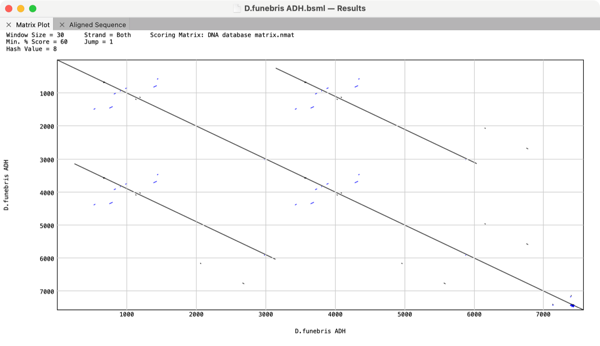
The Dot-Plot analysis (Pustell DNA Matrix) function in MacVector is an extremely powerful way of quickly getting an overview of the similarities between a pair of sequences. However, it can also be used to identify repeats and inversions in a single DNA sequence simply by comparing a sequence to itself. For example here is the Alcohol Dehydrogenase gene cluster from Drosophila funebris.

There is a direct tandem duplication of one set of genes which can clearly be seen by the presence of additional lines that are not on the main “identity” diagonal.
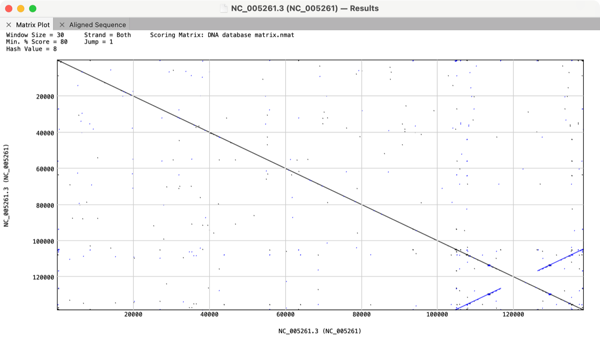
You can use this to identify inverted repeats as well. The display is interactive so that you can zoom in to any part of the plot by a simple mouse drag to go from this;
To this:


The image above shows the inverted terminal repeat from a Bovine herpesvirus with the inverted nature of the repeat indicated by the blue colored lines that go from bottom left to upper right.
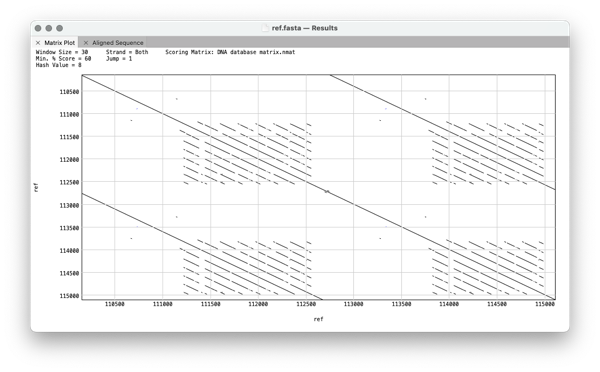
More complicated structures can often be seen.

In this example there is a tandem direct duplication where each repeat itself consist of 7 direct overlapping repeats.
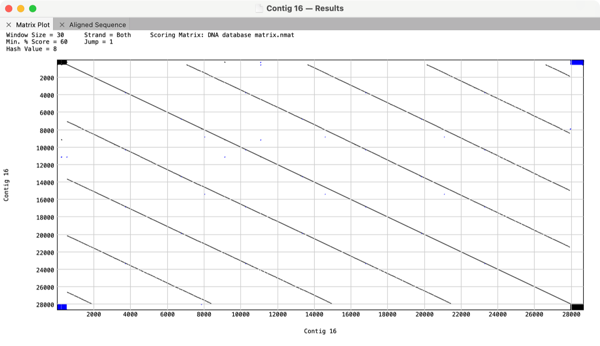
You can also use Dot Plots as sanity checks when running de novo sequence assemblies. Here is an assembly of what should have been a 6.5kb circular plasmid that the assembly algorithm assembled into a 28kb linear sequence consisting of 4 direct copies of the plasmid. This is not uncommon with very noisy long read NGS data where algorithms might assume the high error rate is actually a series of SNPs;

You can also view the textual alignments in the Aligned Sequence tab. That data also updates when you zoom in to a specific region.
Hint: If you try this yourself and get a lot of background “noise”, try increasing the Min. % Score parameter from the default 60% to 80% or higher.
