MacVector provides a wide range of tools for analyzing Protein sequences. In addition to the single sequence analyses present below, you can also align multiple proteins using ClustalW and scan databases for related proteins over the Internet or locally on your own file system.
Protein Analysis Toolbox
MacVector provides a variety of algorithms that you can use to analyze the composition of protein sequences. These range from simple composition reports (counts of each amino acid, pI and molecular weight) to hydrophobicity, antigenicity and secondary structure predictions. All are accessed through a single Protein Profile Analysis dialog.
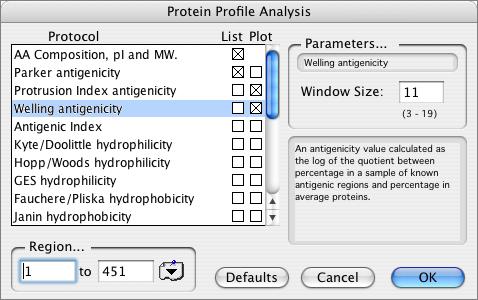
The available algorithms in the Protein Analysis Toolbox are:
Amino Acid Composition
Molecular Weight
pI
Parker Antigenicity
Protrusion Index Antigenicity
Welling Antigenicity
Antigenic Index
Kyte/Doolittle hydrophilicity
Hopp/Woods hydrophilicity
GES hydrophilicity
Fauchere/Pliska hydrophobicity
Janin hydrophobicity
Manavalan hydrophobicity
Sweet/Eisenberg hydrophobicity
von Heijne hydrophilicity
Argos transmembrane
von Heijne transmembrane
Protein flexibility
Amphiphilic Helix
Amphiphilic Sheet
Surface Probability
Chou Fasman secondary structure
Robson Garnier secondary structure
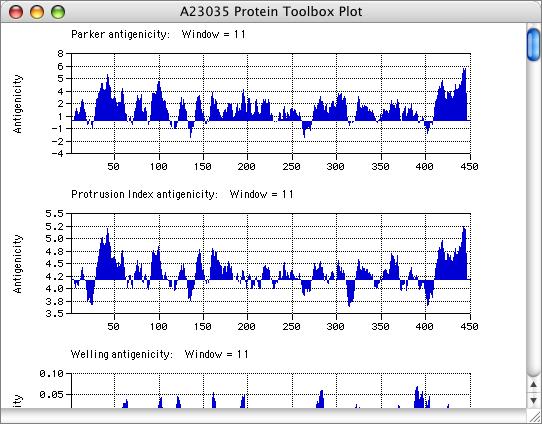
The results can be viewed graphically using filled plots so that you can see at a glance if a protein is above or below the average for the displayed analysis. As with the DNA coding preference plots, you can zoom in to the residue level to closely examine interesting regions.
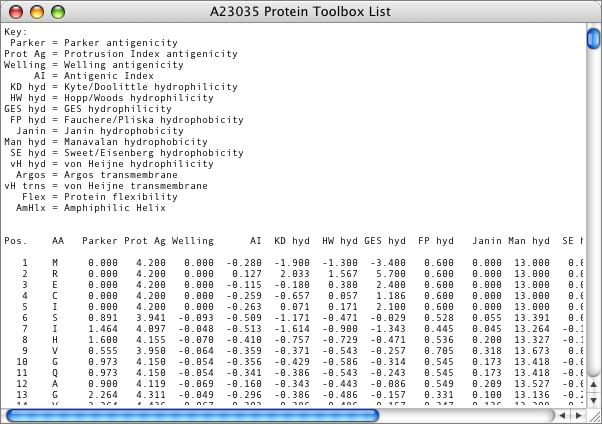
In addition to the graphical display, the results can be viewed in tab-delimited text format. This output is designed so that you can copy the text and paste it into Microsoft Excel so that you can perform additional statistical analysis or combine plots for graphical display.
Proteolytic Enzyme Searches
MacVector lets you scan a protein sequence for proteolytic enzyme cleavage sites in a similar way to searching DNA sequences for restriction sites. MacVector provides a reference file containing all of the currently known useful proteolytic enzymes and you can add your own using the built-in editor. The results can be viewed in text or graphical format, with similar filtering options to those available for restriction enzyme searches.
Amino Acid Motif Searches
MacVector can search for Amino Acid subsequences using a very similar approach to the Proteolytic Enzyme searching functionality. However, you can use subsequences with complex patterns for the search – each pattern can have up to three distinct segments, separated by variable inter-segment regions, and you can control the overall similarity required for a match as well as defining residues which must be 100% conserved. MacVector ships with a number of default amino acid subsequence files derived from the popular PROSITE database.
Reverse Translation
You can reverse translate a protein into its equivalent degenerate DNA sequence using the translation code of your choosing. In addition to creating the corresponding DNA sequence, MacVector can also scan the sequence for the least degenerate nucleotide sequences than can be used as probes or PCR primers to identify those sequences in a genomic library.
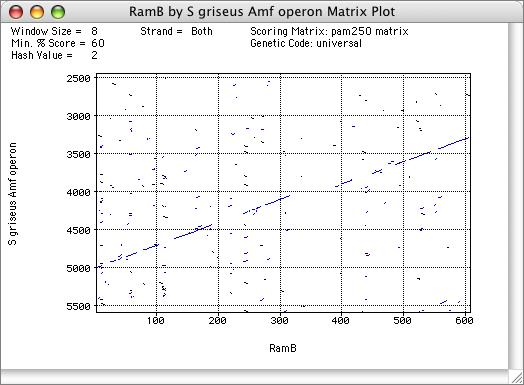
Dot-Plot Analysis
Pairs of protein sequences can be scanned for sequence similarity to each other using the Dot-Plot functionality, in a similar way to DNA sequences. However, you can also compare a protein sequence to a DNA sequence to identify weak relationships between a protein sequence and a related protein-encoding DNA sequence.