
Tag: annotation
-
Functional domain analysis of protein sequences using InterProScan
There’s a new tool in MacVector 15 that allows you to do functional domain analysis on your protein sequence using the InterProScan service. InterPro contains multiple databases of protein families, domains and motifs and InterProScan will submit a protein sequence to a search of these databases. It will also do extra analysis such as transmembrane…
-
Batch auto annotation of blank sequences with MacVector and AppleScript
Over the past few releases we’ve been making more MacVector tools to be scriptable with AppleScript. The latest is Auto Annotation. Auto Annotation is a great tool for curating your sequences. For example if you receive a unannotated sequence then you can scan it against other sequences to find. Blasting an unknown sequence, fetching the…
-
Viewing external database entries for features in a sequence.
Sequences, or regions of sequences, can be linked to external databases. For example an entire sequence entry or for when annotation tools are used to annotate proteins with domain or motif information (e.g. InterProScan available in MacVector 15). Very useful for when you want to view more detailed or updated information. Within the Genbank specification,…
-
Drag and drop to quickly annotate ORFs
You can use the Analyze | Open Reading Frames function to very quickly find ORFs on a sequence. Did you know that you can very quickly turn those results into permanent CDS features on your sequence? After running the Open Reading Frames analysis, simply drag and drop the ORF objects you are interested in from…
-
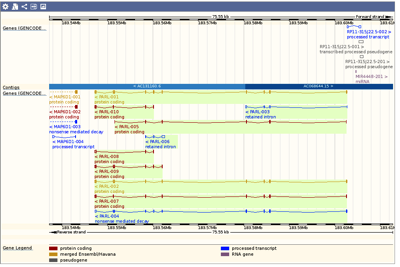
Importing sequences/features from websites such as ENSEMBL or UCSC’s Genome Browser
Many Genome Browsers/databases allow you to browse and view genomes, or a specific gene/region, with a high degree of detail. For example ENSEMBL and the UCSC Genome Browser. However, many times you want to work with that data on your own Mac. As usual the easiest way to exchange sequence data is using the Genbank…
-
Visualizing ORF analysis results in the MAP tab
The Map tab is a powerful way to visualize and interact with your sequences. You can design primers, ligate and digest fragments from the Cloning Clipboard, visualise translated CDS regions and much more. The Map tab of a Results window is just as flexible as the Map tab of the main sequence window. You can…
-
Annotating the sequence in the Editor tab
You can very quickly annotate a region of interest in your sequence in the Editor tab. For example showing introns in lower case or highlighting CDS features with a colored background. To enter sequences as mixed case. To color a region. To change the case of a region.
-
Displaying features in the Editor tab
The Map tab shows a richly detailed graphical representation of your sequence. However, sometimes you just need a overview of annotation along with sequence. MacVector makes it easy to display features directly on the sequence in the Editor tab. Only a subset of a sequence’s features are displayed due to limited room. You can choose…
-
Editing the appearance of your sequence maps
Although we think that the default appearance of sequence maps in MacVector is very pretty, sometimes the defaults are not to everybody’s taste! If you think this way, then changing how maps look is very easy. As usual with MacVector, there are many ways to quickly edit the appearance of a feature or multiple features.…
-
How to increase the number of graphics levels to stop features overlapping.
MacVector tries to optimize the Map graphics layout using a trade-off between performance and minimizing unnecessary white space. Sometimes the default settings we have chosen are not ideal, particularly if you are looking at the Map tab of an Align To Reference window where you have a large number of reads overlapping the same region.…