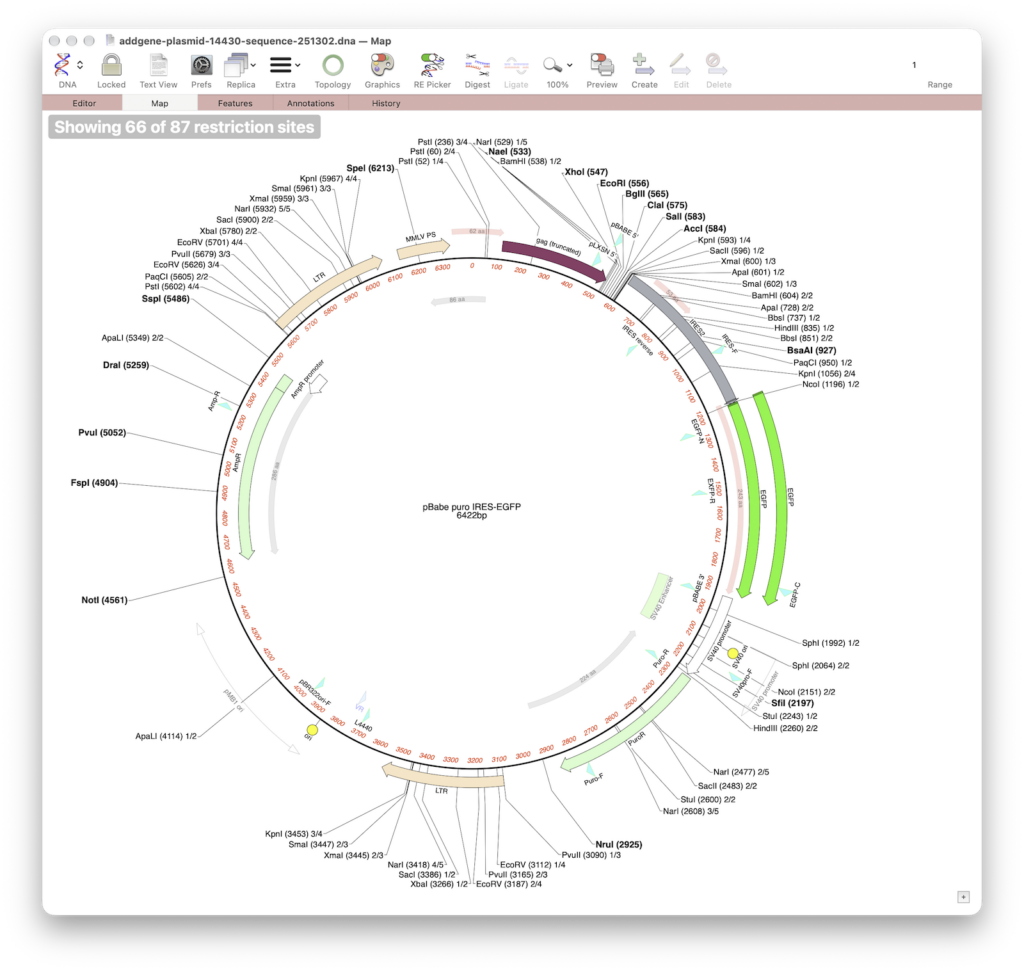

MacVector has always been about producing beautiful plasmid maps. Our latest release MacVector 26.1 takes this to a new level with customization of dynamically generated maps with Smart Line graphics.
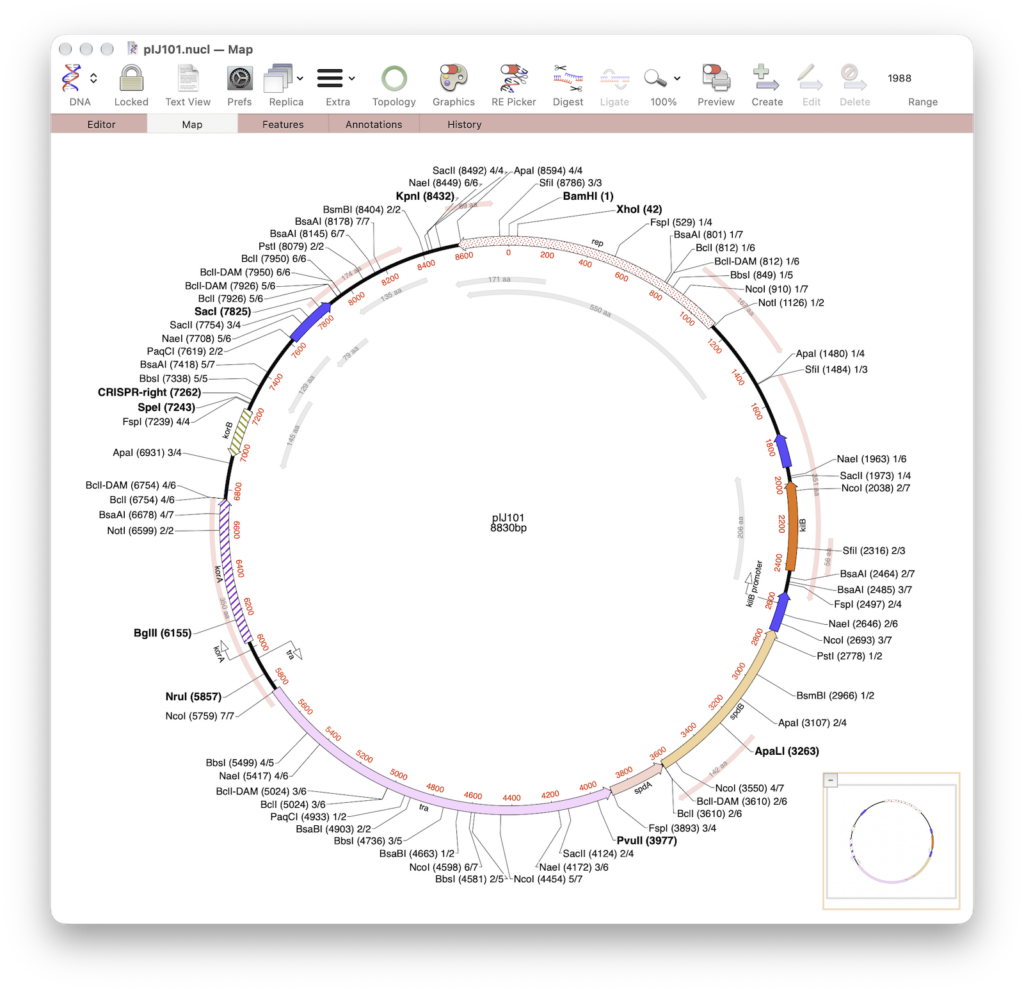
MacVector gives the user great flexibility for customizing graphical maps. They look how you want them to look. Every aspect can be changed, fonts, colours, symbols and size. With MacVector 26.1’s Smart Line symbols this now applies to dynamically annotated restriction maps too.
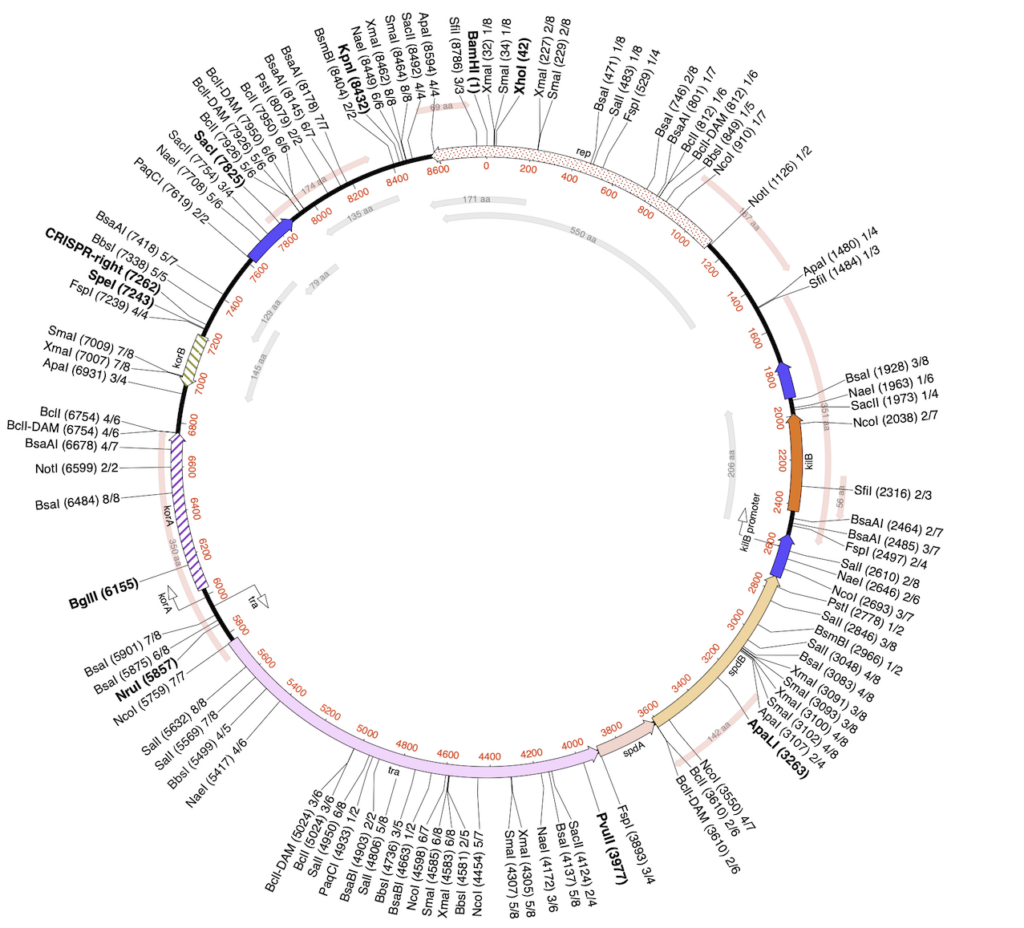
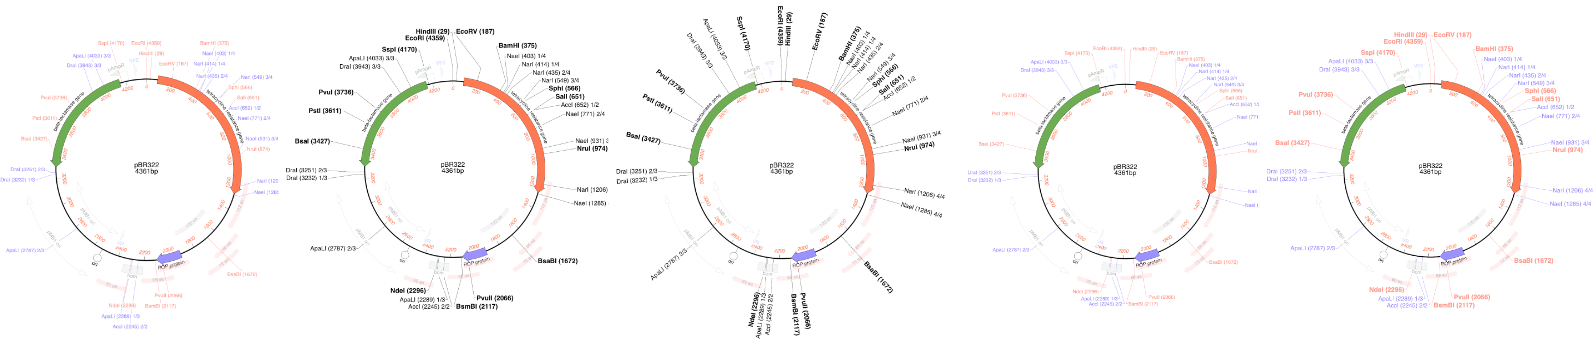
MacVector’s new Smart Line presets give you no less than five different styles to use. All use slightly different algorithms to produce aesthetically pleasing graphical maps. Even with crowded vector maps!
SmartLine presets
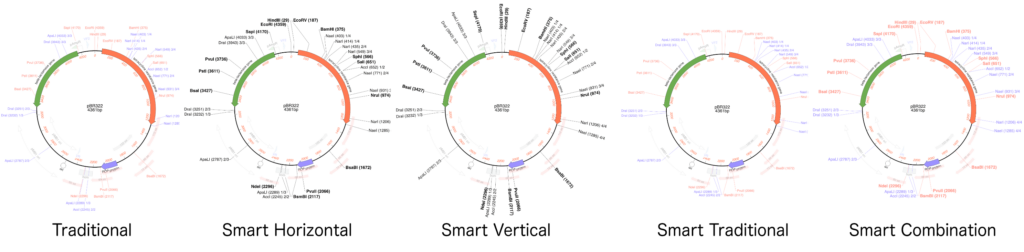
- Traditional – A single blue line will point to a label.
- Smart Horizontal – A black line will point to your label (horizontal black text). Unique sites are displayed in bold in a slightly larger font size. For circular maps the line is adjusted depending on whether the label is shown on the left or right of the line.
- Smart Vertical – A line will point towards a label which will be shown in the same orientation as the line. So vertically for linear maps and perpendicular to the sequence for circular maps.
- Smart Traditional – This is similar to Traditional but uses the new algorithm to layout sites.
- Smart Combination – This uses elements from both Traditional and the new Smart presets.
All of these presets are customizable. You can change the colors and fonts to be whatever you want!
Smart layouts on busy maps!
SmartLines graphics will always try to show all enzymes that you are looking for. When you first open a sequence a banner will appear showing whether all sites are shown.
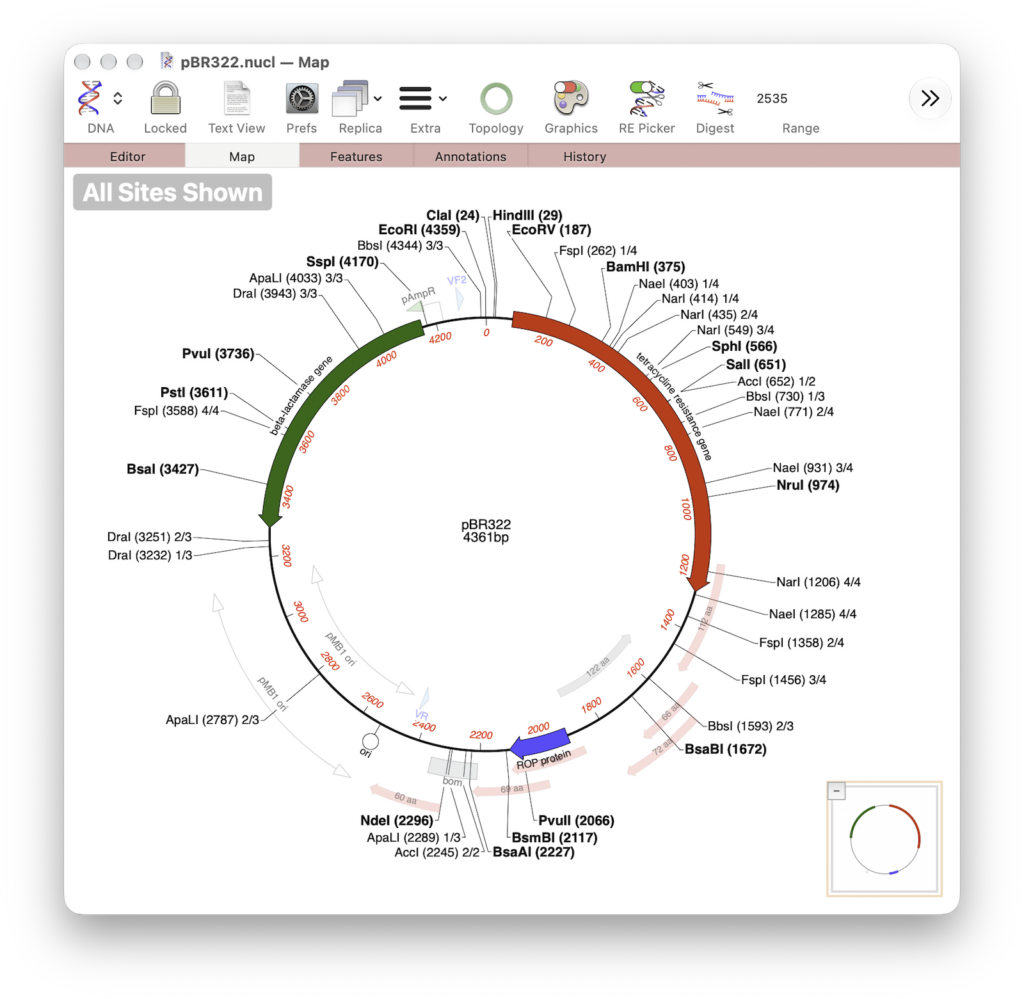
However, on sequence maps with a high density of maps then it is not always possible to create a readable map as many site labels will be overlapping. So in these situations SmartLines will only show a subset of sites. You always have the option of increasing the window size and refreshing the map (double click in the window).