In recent years there has been an explosion of whole-genome sequencing projects. One common question coming out of this has been to ask:
“Exactly what are the genetic differences between my sequenced organism and another related strain?”
MacVector to the rescue! MacVector’s Compare Genomes By Feature… tool lets you see the differences between two annotated genomes in fine detail.
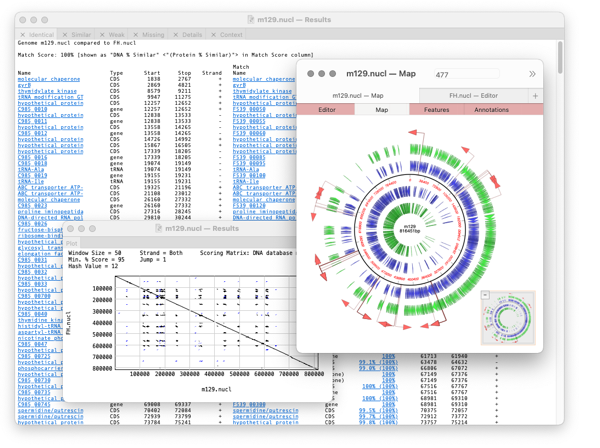
The algorithm takes every annotated feature from the source genome and looks for the presence of that feature in the comparison genome based on sequence similarity. CDS features are even translated so that the predicted amino acid sequences are compared. The results are then tabulated to show identical, closely related, and weakly related features in separate tabs, with additional tabs for features that are completely missing and a “details” tab that shows the low-level alignment details for any matching pair of features. Hot-links in the result tabs let you quickly scroll the parent sequences to any individual feature of interest.
How to compare a pair of genomes
Compares two related annotated genomes (or smaller sequences) to identify and list, in spreadsheet form, identical, similar and weakly similar features along with missing features.
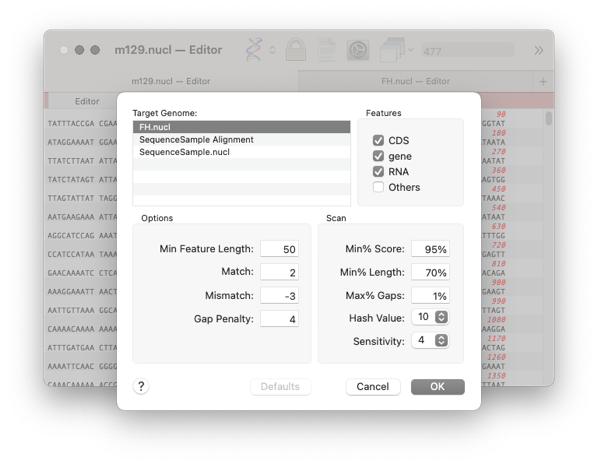
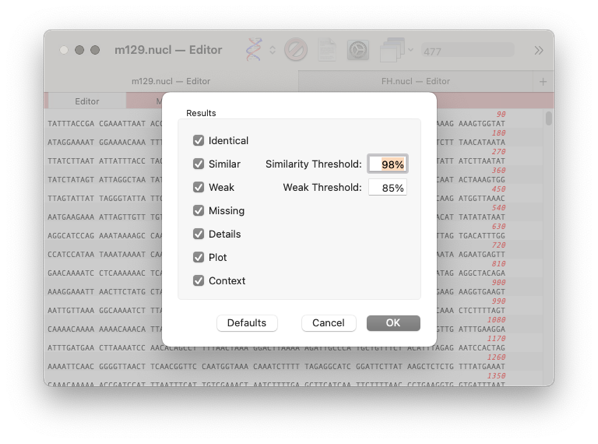
A results window will appear with the following tabs
Identical, Similar, Weak, Missing, Details, Plot, Context

The first three tabs refer to the similarity of a feature between the two genomes. The differences are set in the previous dialog with the threshold setting.
Identical lists all of the features that are perfectly conserved between the two genomes based on sequence identity, even if the names and qualifiers are different. CDS features are translated and the amino acid sequences compared, so there may be silent mutation differences in the encoding DNA sequences.
Similar shows matches that are not identical but match or exceed the Similarity Threshold.
Weak lists all the remaining matches that exceeded our initial search criteria but were not sufficiently similar to be included on the Similar tab.
Missing refers to features that are completely absent in the second sequence
Details tab is used to display feature alignments when you click on a hotlink in the first three tabs.
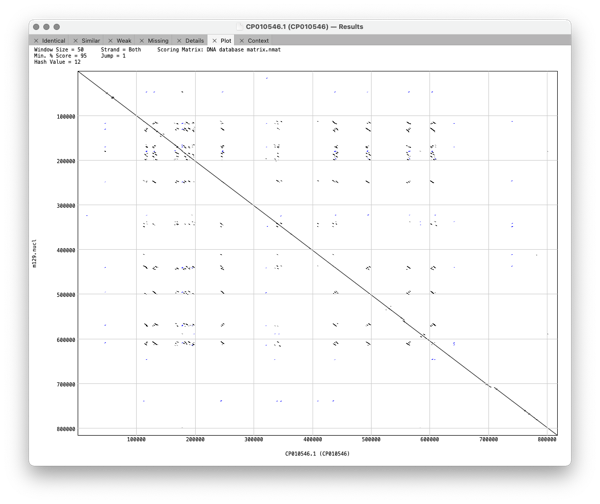
Plot shows a dot plot of your pair of sequences so you can visualise the relationship between the pair of genomes.
Context shows the alignment between the pair of genomes.
The format of the results tabs
For the first three tabs the format is similar. The first five columns are the “name”, type, start, stop and strand of the feature in the parent sequence i.e. the sequence that you had frontmost when you invoked the search. The “name” is the label that appears in the Map tab for the feature. By default, for CDS features, this would be the /gene= qualifier, but this can be configured on an individual feature basis or for all features of a type. The rightmost columns provide the same information for the feature(s) that matched on the target genome except that there are is an extra Match Score column. This displays the DNA identity score for each pair of features along with, (in brackets) the identity score for the predicted amino acid translation for CDS features given the current default genetic code.
Note that features that are duplicated in the target genome will show additional matches.
Note that when multiple matches are found, if one of them has a 100% match, all of the matching features are shown in the match list,
even if they do not also have 100% identity. This approach ensures that you are always aware of duplicated/pseudogenes with significant but non-identical matches.
The display is highly interactive and you can click on any blue hotlink to view more information about it.
For example if you click on a hotlinked feature name in the first column then the parent sequence document is brought frontmost, switches to the Features tab and highlights and scrolls to the corresponding feature. So, you can use this shortcut to quickly jump to any feature of interest.
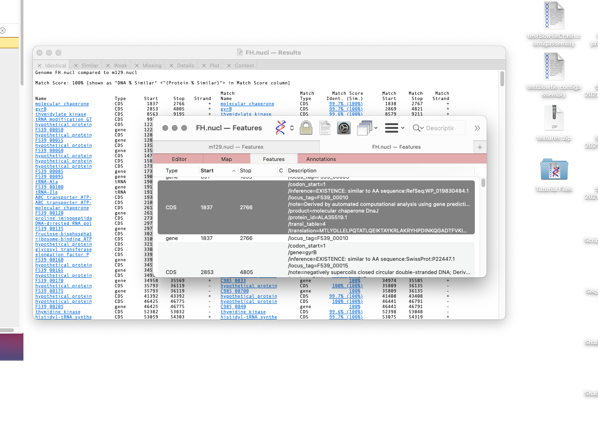
Alternatively If you click on the target genome gene names then the window changes to select the Details tab and shows the sequence alignment between the two features.