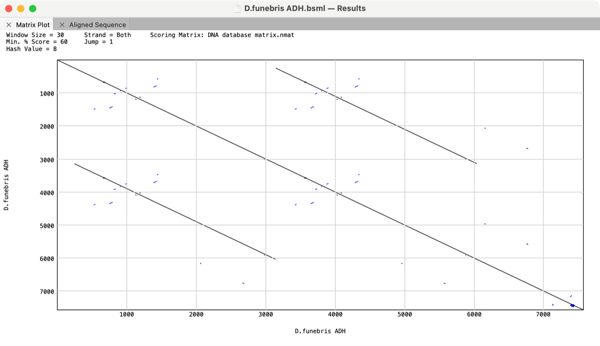
The Dot-Plot analysis (Pustell DNA Matrix) function in MacVector is an extremely powerful way of quickly getting an overview of the similarities between a pair of sequences. However, it can also be used to identify repeats and inversions in a single DNA sequence simply by comparing a sequence to itself. For example here is the…
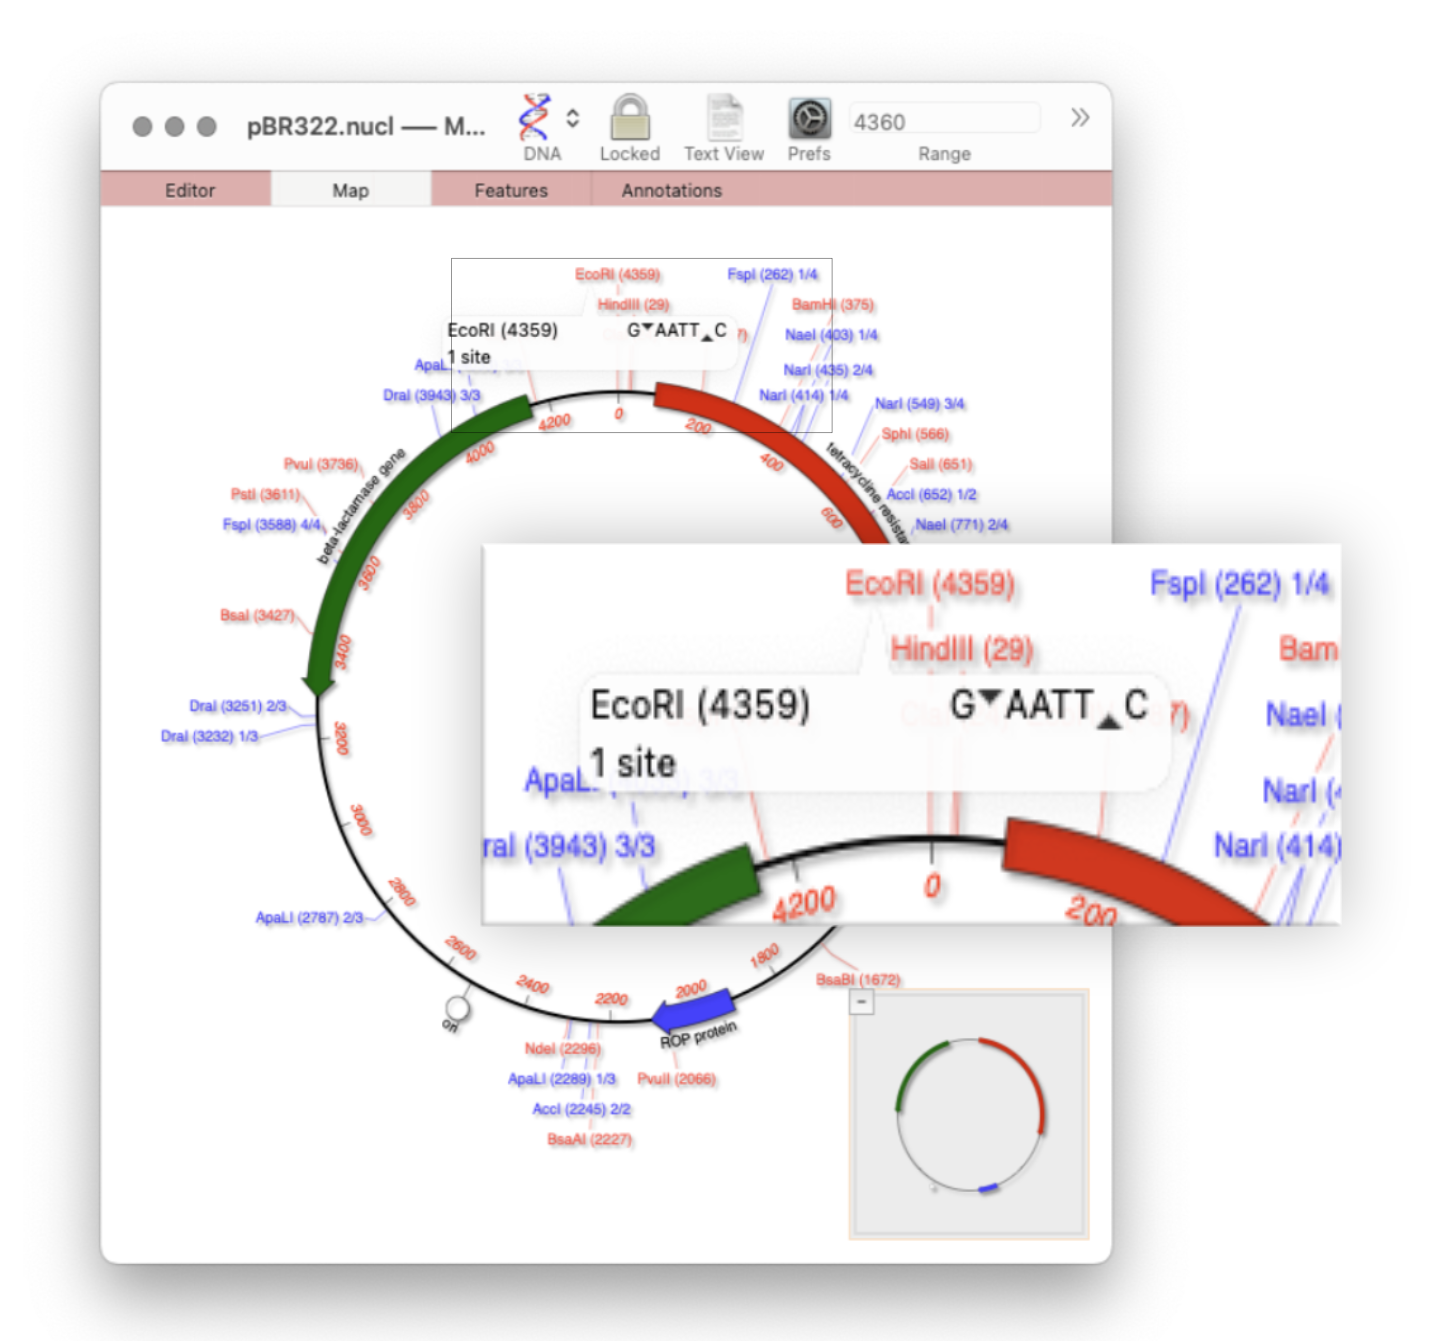
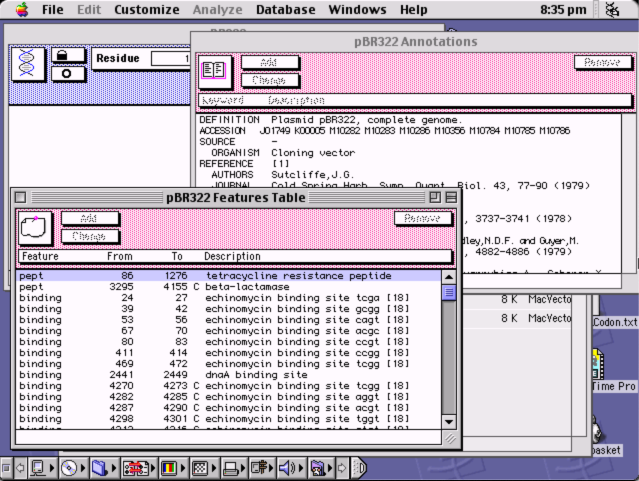
Quickly viewing the recognition sequence and cut site of a restriction site is very easy in the Map tab. By default MacVector’s Scan DNA For… tool will automatically display restriction enzyme recognition sites in the Map tab. If you hover your mouse over a restriction site, a tooltip will show you the restriction enzyme recognition site, the location of the cut…
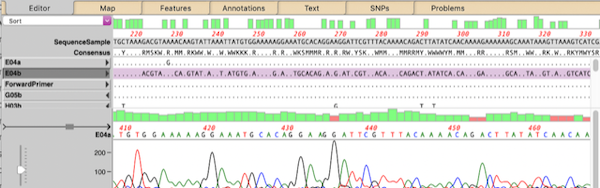
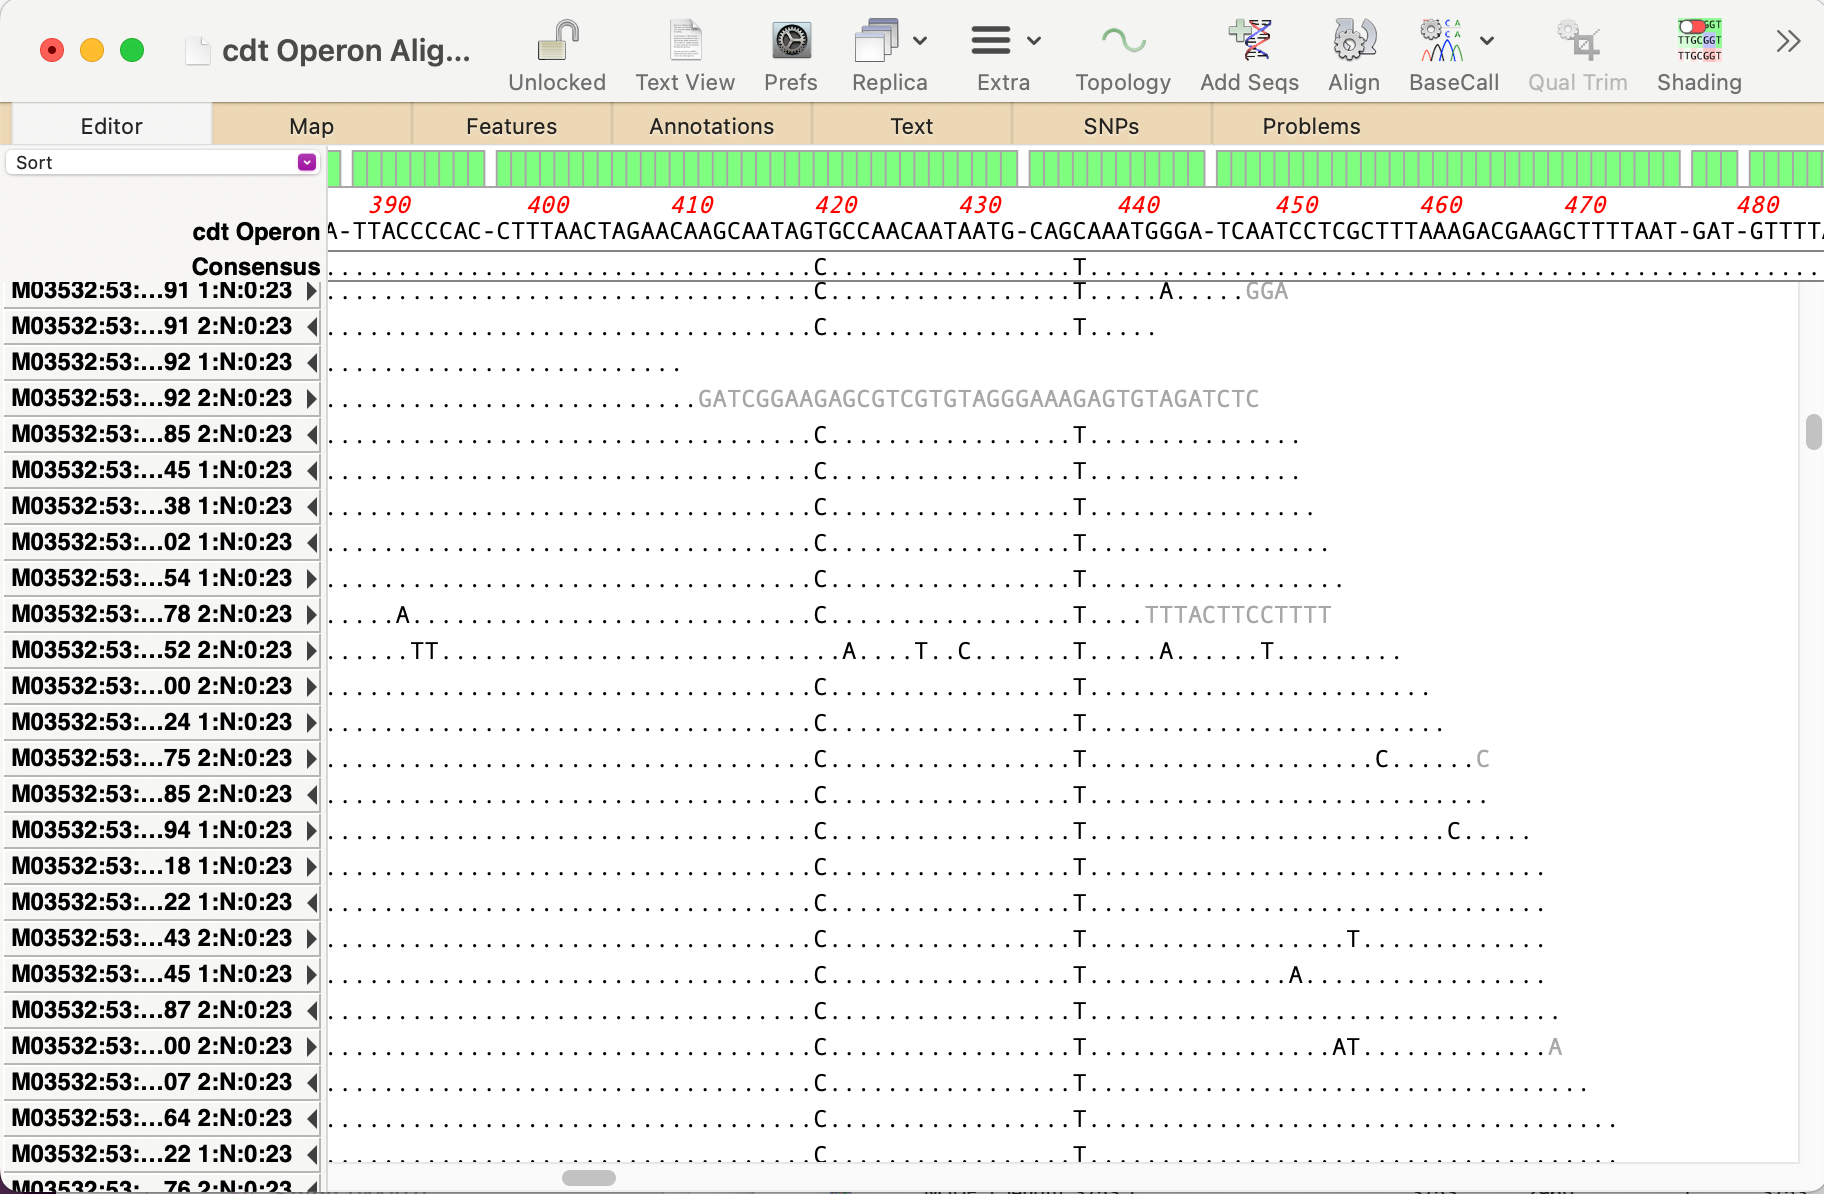
You can use the Analyze | Align to Reference function to align other sequences (Sanger chromatograms, plain sequences or even NGS data collections) against a reference. Once aligned, the Editor lets you perform all the usual editing functions using an “overwrite” mode – select the residue you want and type the new residue to replace…
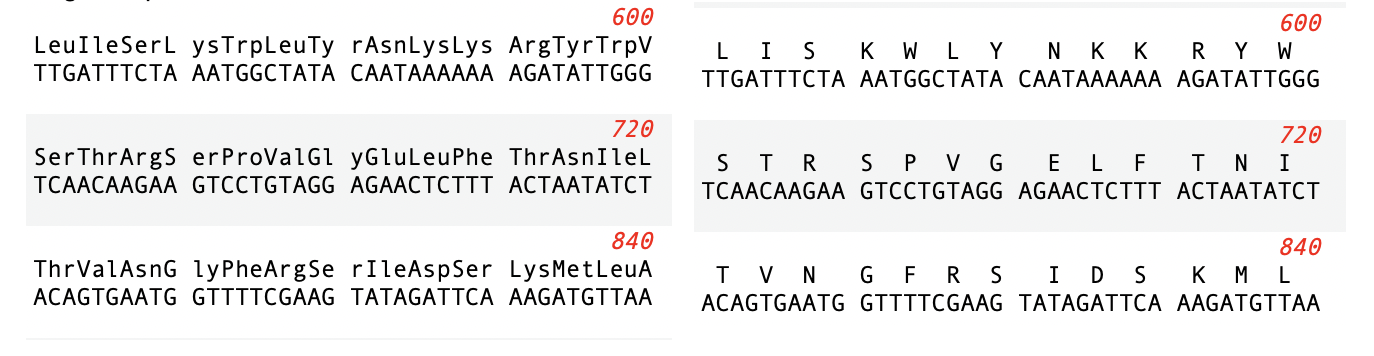
Many views in MacVector display amino acid translations above or below DNA sequences. Typically, these are from CDS features, but can also be the 3/6 frame translation of a sequence. You can display the amino acids as either the single-letter code, or as the three-letter code. You can toggle the setting using the MacVector | Preferences ->…
Over the years, we have added a lot of drag and drop functionality to MacVector. Of course, as with any application, it is not always obvious that you can drag and drop to accomplish tasks because you literally have to drag and drop to discover you can do it at all! So here is the first of…
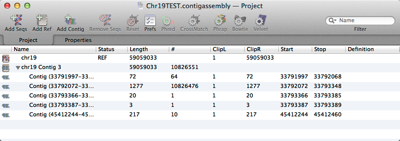
MacVector’s Assembly Project manager helps you organize multiple sequencing datasets, multiple reference sequences and repeated assemblies. You can store multiple assembly jobs in a single Assembly Project and directly compare multiple runs of the same dataset to determine the best assembly parameters. You can also compare different sequencing datasets assembled against the same reference sequence…
When analyzing/assembling/aligning NGS data, there are many scenarios where you might want to separate out the reads representing different genotypes or variant sequences. MacVector makes this very easy. Take a reference sequence and choose Analyze->Align to Reference. Now click the Add Seqs button and select and add your NGS data files. NOTE: if your reference…
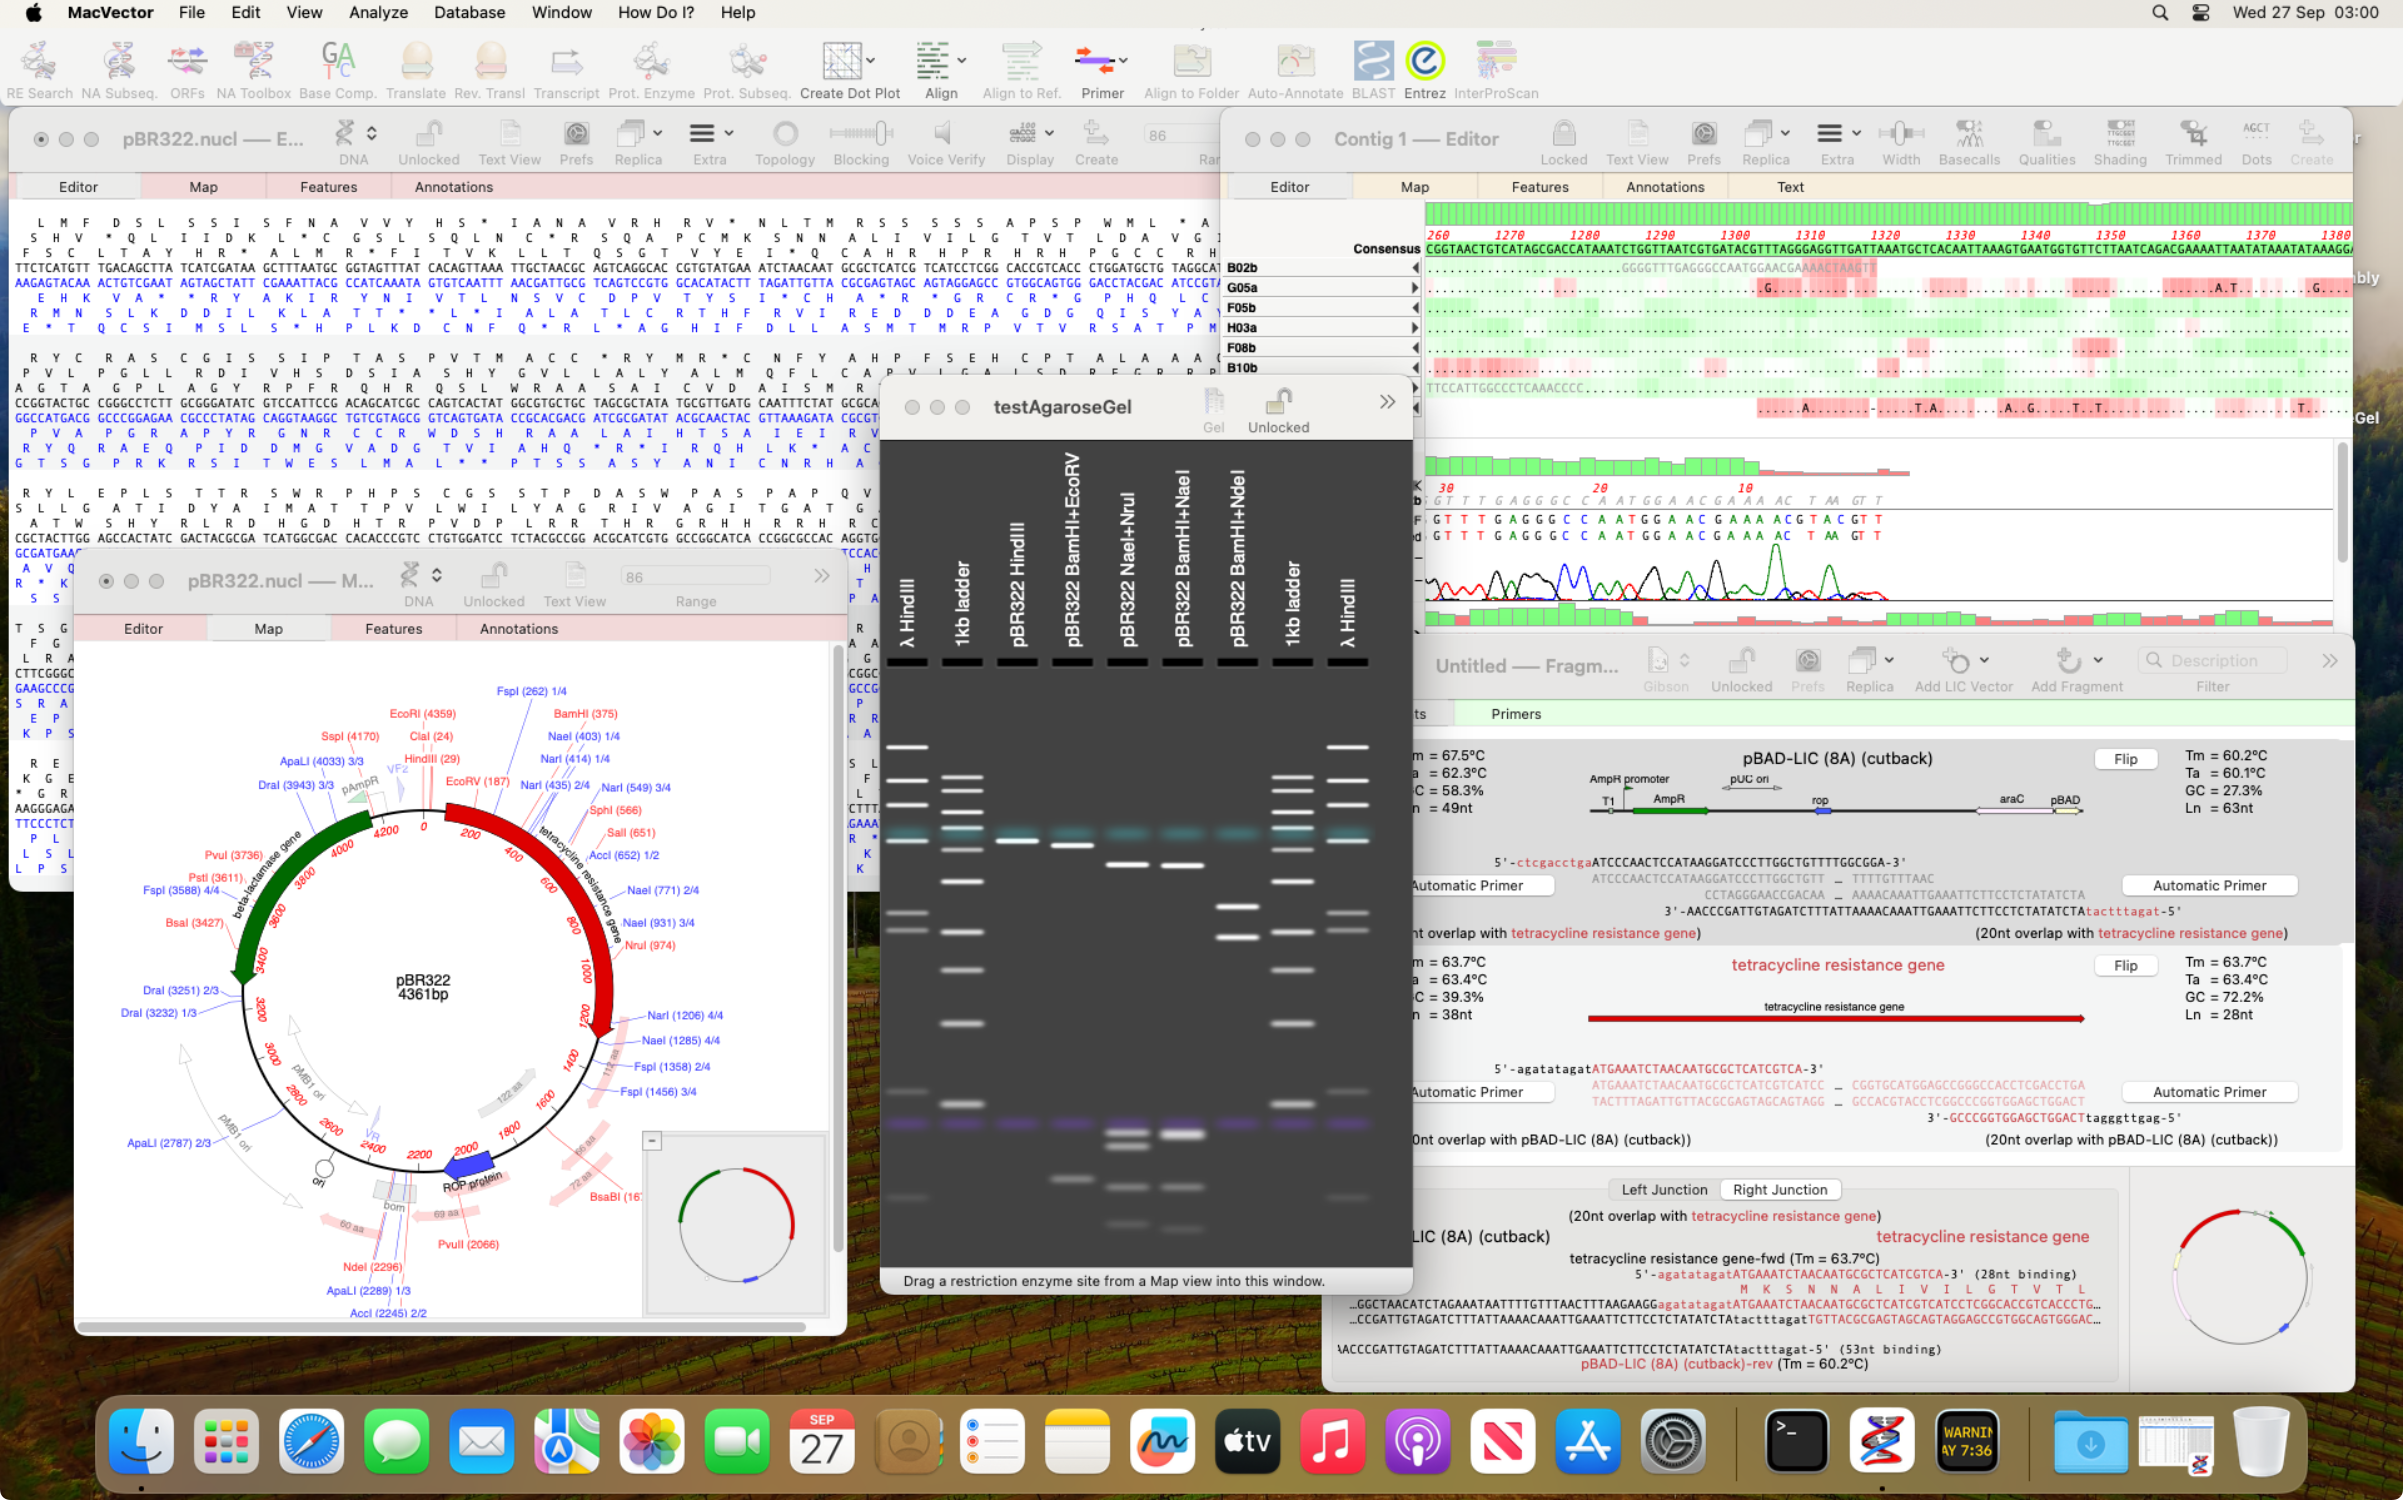
So it is forty years since Steve Jobs walked onto the stage and announced the Mac! MacVector did not come about until six years later as MacVector 1.0 was released in March 1990! But we are still proud that MacVector has now been running on the Mac for over thirty years. Especially that MacVector 18.6…
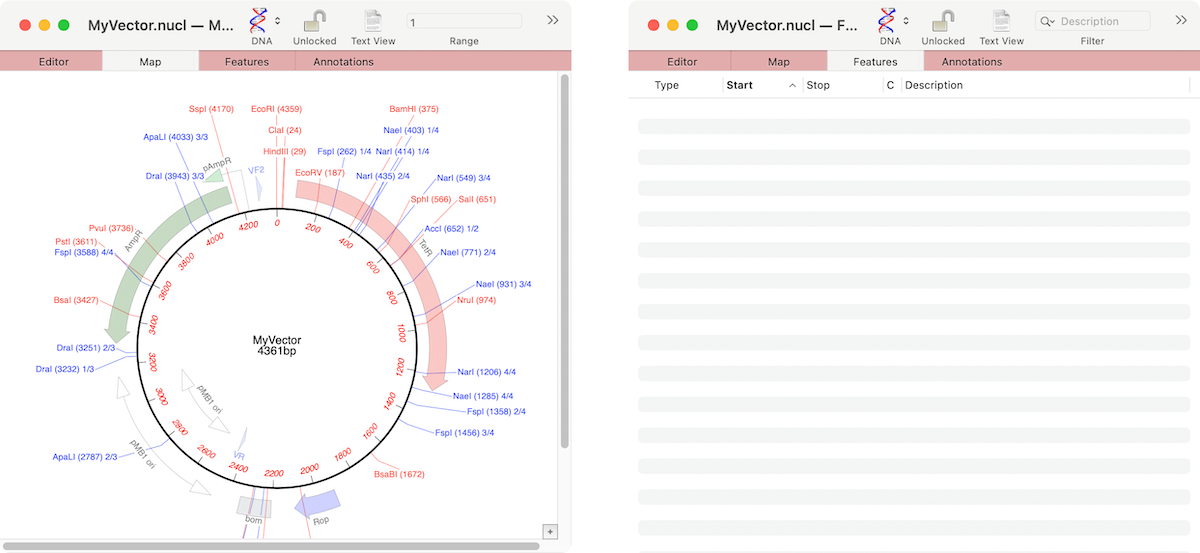
If the graphics in a nucleic acid sequence Map tab appear somewhat “washed out” it is because the graphic items represent common features that MacVector has found that are not annotated on the sequence. For example, here are the Map and Feature tabs of an unannotated cloning vector. You can see a number of features…
Apple released macOS Sonoma yesterday (Tuesday 26th Sept 2023). As usual in the run up to a new macOS release, we have been testing MacVector on development builds of macOS Sonoma. Unfortunately, at a late stage we found an undocumented change that affects a few tools in MacVector. MacVector uses a number of third party…